


March was an incredible month for the Buffer blog, not only in terms of traffic but also in terms of change—so much so that calling this update the Buffer Blog Report doesn’t seem to do the month justice. At the very least, we’d have to call it the Blogs Report (plural on blog; more on that below).
Big changes were afoot in March: blog strategies, audits, goodbyes, and so much more. It’s exciting to share this all with you and see what you think. So without further ado …
Quick summary of the Buffer blog
In March, we passed the 700,000 mark in unique visitors—a 7 percent jump from the previous period. We had nearly 940,000 total visits, resulting in 1,175,000 pageviews, leading to 1,935 conversions.
Since February’s 28 days can throw comparisons into disarray, all the numbers you see below compare the 31 days in March to the prior 31 days (spanning all of February and the last few days in January).
March stats for the Buffer blog
- 717,070 unique visitors (+7.66% from last month)
- 939,386 total visits (+6.14% from last month)
- 1,175,759 pageviews (+4.69% from last month)
- 21 total posts published (-1 from last month)
- 20 in-house posts: 10 from Kevan, 8 from Belle, 1 from Courtney, and 1 from Joel
- 1 guest post: from James Clear
- Email subscribers: 20,256 total subscribers, 1,567 new subscribers in March (8.3% list growth from 18,814 last month)
Top 3 referral sites:
Twitter (195,071 visits), Facebook (49,836 visits) and Feedburner (41,173)
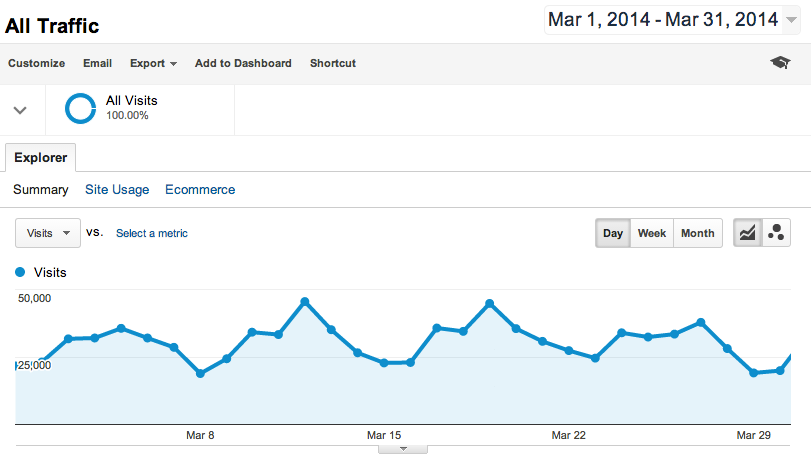
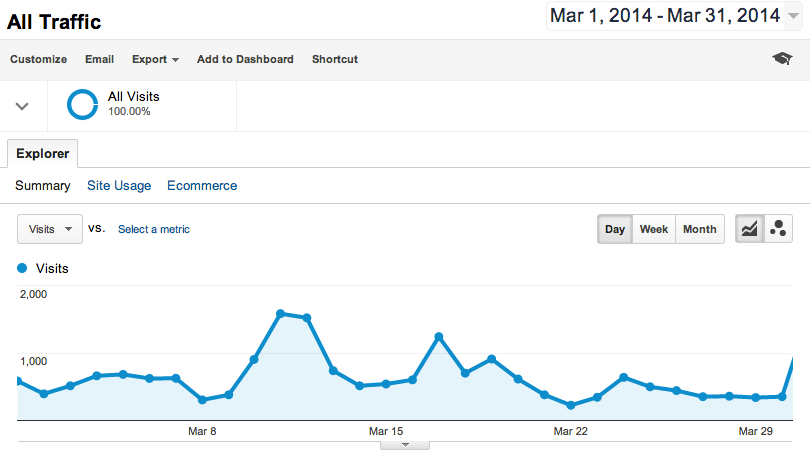
Below is our traffic graph from February. As you can see, we had a few spikes in traffic during the month, the greatest spike being Wednesday, March 12, our most popular day on the blog. Did you happen to stop by then? If so, thanks!
March’s 10 most popular posts
Checking stats on the past few months, it has been fascinating to see the staying power of Belle’s 10 Simple Things You Can Do Today That Will Make You Happier. Her post consistently grabs the top spot month-after-month, an amazing feat for content that was first published in August 2013.
Seeing that many of March’s top posts were originally published before the month began, I thought it might be helpful to mark the posts that did go live in March with an asterisk. Six out of the top ten were March originals.
- 10 Simple Things You Can Do Today That Will Make You Happier, Backed By Science
- Why Facebook is blue: The science of colors in marketing
- * The Science of Emotion in Marketing: How Our Brains Decide What to Share and Whom to Trust
- * Twitter Tips for Beginners: Everything I Wish I Knew When I Started
- 8 Surprising New Instagram Statistics to Get the Most out of the Picture Social Network
- 8 Common Thinking Mistakes Our Brains Make Every Day
- * 5 More Unexpected Ways to Work Harder, Not Smarter
- * The Best Time to Write and Get Ideas, According to Science
- * Sleep Your Way to Creativity and 9 More Surefire Methods for More Creativity
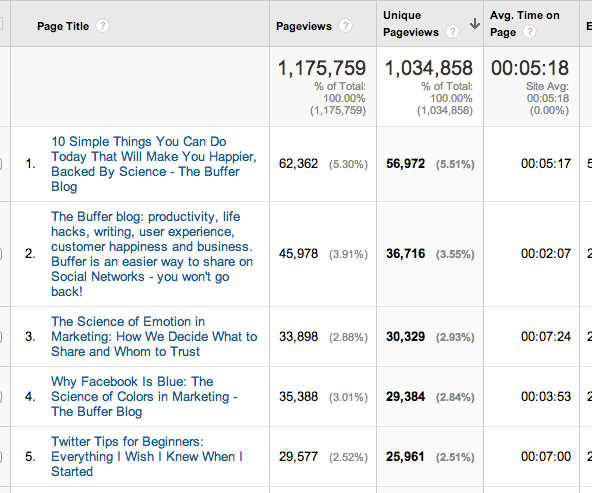
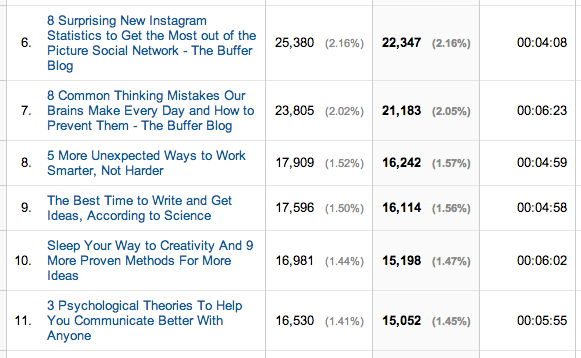
You can see how many views each of these top posts received by looking below at our Top Content page in Google Analytics. I’ve expanded the list below to the top 11 because the number two result pictured here is actually the blog.bufferapp.com root domain.
Top referral sources
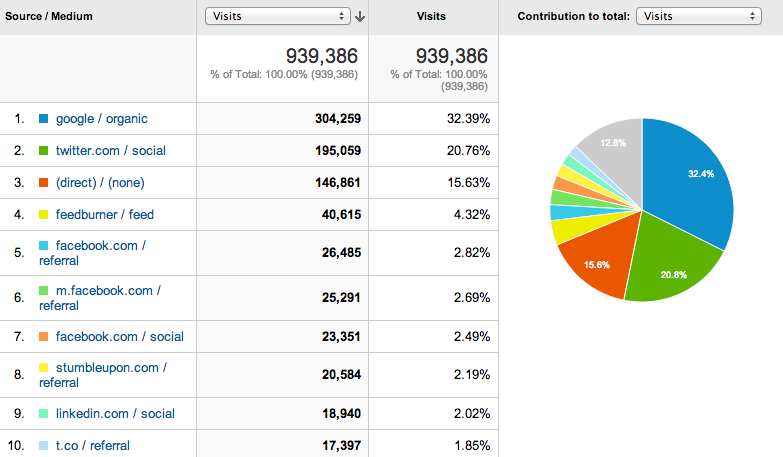
Here is a look at the sources that brought the most blog traffic. You can see from the pie chart that the top three sources—Google search, Twitter, and direct traffic—account for a significant majority of visitors.
Top republishing sources
- 26 total posts republished: (+13 from February)
- Sources: The Next Web, Lifehacker, Fast Company, Huffington Post, Inc., Time, Business Insider, Search Engine Journal
1. Fast Company
Traffic: 8,728
Conversions: pending
Conversion rate: pending
2. Lifehacker
Traffic: 4,466
Conversions: 181
Conversion rate: 8.7%
3. Inc.
Traffic: 3,763
Conversions: 354
Conversion rate: 27%
4. Huffington Post
Traffic: 3,279
Conversions: 177
Conversion rate: 17.9%
5. Business Insider
Traffic: 2,907
Conversions:
Conversion rate:
Thoughts and outlook
Belle says good-bye
Belle Beth Cooper, our first content crafter and who we consider to be the gold standard for craveable content, wrote her final post for the blog last month. We owe so much of the blog’s success to her amazing contributions over the past year, and we will be cheering her on raucously as she builds her own startup.
We collected our favorite Belle articles in a good-bye post; they are well worth the read—as is everything she has written for us.
Meet our new Head of Content Marketing
Courtney finished her six-week Buffer Bootcamp in March and became Buffer’s Head of Content Marketing, a very well-deserved title that reflects the incredible leadership and initiative she has showed for the Buffer blog and Buffer’s marketing efforts as a whole. You can expect to see her in a variety of places across Buffer’s marketing channels, including our newest experiment into webinars. Courtney led our first webinar with Moz in March.
Doubling the amount of Buffer blogs
We found ourselves in an interesting paradox, marketing-wise.
Content on the Buffer blog could generally fall into two categories: marketing and lifehacks. Marketing posts convert extremely well but bring in fewer visits, whereas lifehacks convert poorly but are huge for traffic and republishing opportunities.
So we gave each of them a home.
The original Buffer blog is now home to content focusing on all things social media—research, advice, tools, tips, and everything else in-depth and actionable you have come to expect from us. The Buffer Open blog (the one you’re reading now) is going to host our experiments in productivity, lifehacks, and all things Buffer culture and transparency.
To that end, we are ramping up our efforts to get the word out about our Open blog. If you follow us on social media, you might start noticing more shares of our Open blog articles, both because the volume is increasing here and because we think it’s some pretty neat stuff you might want to see.
Traffic is going to be an interesting stat to track as well. We’re happy to share with you what this looked like in March, and I hope to bring some big numbers at the end of April.
March stats for Buffer’s Open blog
- 14,694 unique visitors
- 20,158 total visits
- 31,198 pageviews
- 9 total posts published
- 711 email subscribers
Here’s our traffic graph from March:
Performing a blog audit
Rethinking the vision for the Buffer blog and choosing to go in a pair of exciting directions gave us the perfect opportunity to make a to-do list. We made note of as many technical quibs, design changes, and usability features that we could find, and we plan to tackle these in short order. A blog audit like this a fun side effect of pivoting your blog; who knows when we would have made time for it otherwise.
Is there anything you’ve noticed on the Open blog or the Buffer blog that we could improve? We’d be thrilled for your feedback.
Tracking social stats
When writing about social media marketing, it sure is nice to test and iterate on your own social media accounts. We had the chance to do just that with a social media audit, spurred by a post we wrote on the Buffer blog. We’d like to start sharing our social media progress with you here every month. Here are some of the numbers from March.
Followers
- Twitter: 193,833 (+2% change from last month)
- Facebook: 22,698 (+1.5%)
- Google+: 78,105 (+14.46%)
- LinkedIn: 2,138 (+8.64%)
Interactions per post
- Twitter: 228 (+4%)
- Facebook: 65 (-26%)
- Google+: 86 (-2%)
- LinkedIn: 22 (+5%)
You can view the full spreadsheet to see our complete stats (and download the template for your personal use, too).
What other insights would you find helpful for us to share? Are there any questions about our blogs, our team, or our social media marketing that we can answer? Please do share them in the comments, and we’ll be happy to chime in.
Image credit: heanster
Try Buffer for free
140,000+ small businesses like yours use Buffer to build their brand on social media every month
Get started nowRelated Articles

Note: This is the quarterly update sent to Buffer shareholders, with a bit of added information for context. We share these updates transparently as a part of our ‘default to transparency ’ value. See all of our revenue on our public revenue dashboard and see all of our reports and updates here . It's been quite the y

Editor’s Note: Thanks for checking out this post! We’ve released our updated 2021 pay analysis here. You can’t improve something if you don’t know that it needs to be improved. That was very true for us four years ago when we first started looking into equal pay at Buffer. We have long used a salary formula to determine all of our salaries – the same role in the same part of the world receives the same salary. That m

Ever since the world got turned upside down by COVID-19, it’s been “business as unusual” for everyone – Buffer included. I sent this update out to Buffer’s investors one week ago. I hesitated on whether to share it more widely, as I know a lot of companies have been impacted more severely in these times. That said, I believe it makes sense to lean into our company value of transparency, since there may be some companies this could help, and it shows Buffer customers that we will be around beyon