
On The Journey to Equal Pay: Here’s Exactly What Men and Women Earn at Buffer


Head of Communications & Content @ Buffer
At Buffer, we feel a close connection to the conversation about salaries.
We strive to pay all employees fairly and equally, as evidenced by our adoption of a transparent salary formula. We share this formula publicly (you can try it for yourself here), and we share the actual salaries of the entire Buffer team: Every one of our salaries is available in a transparent spreadsheet.
We whole-heartedly embrace transparency with salaries, which is why we’re thrilled for days like today — Equal Pay Day, which brings awareness to the pay gap between the salaries of men and women.
We’re grateful for the privilege to participate in Equal Pay Day by sharing our updated numbers for how the salaries of men and women compare at Buffer. Read below to see the full breakdown of Buffer salaries in 2017, including all the data shared transparently and a rather unique outcome with our gender pay gap.
Setting a Benchmark: How the Gender Pay Gap Differs Around the World and Across Industries
As you might expect, there are many factors that can influence the gender pay gap. As a remote tech company, we experience two of these factors quite significantly: location and industry.
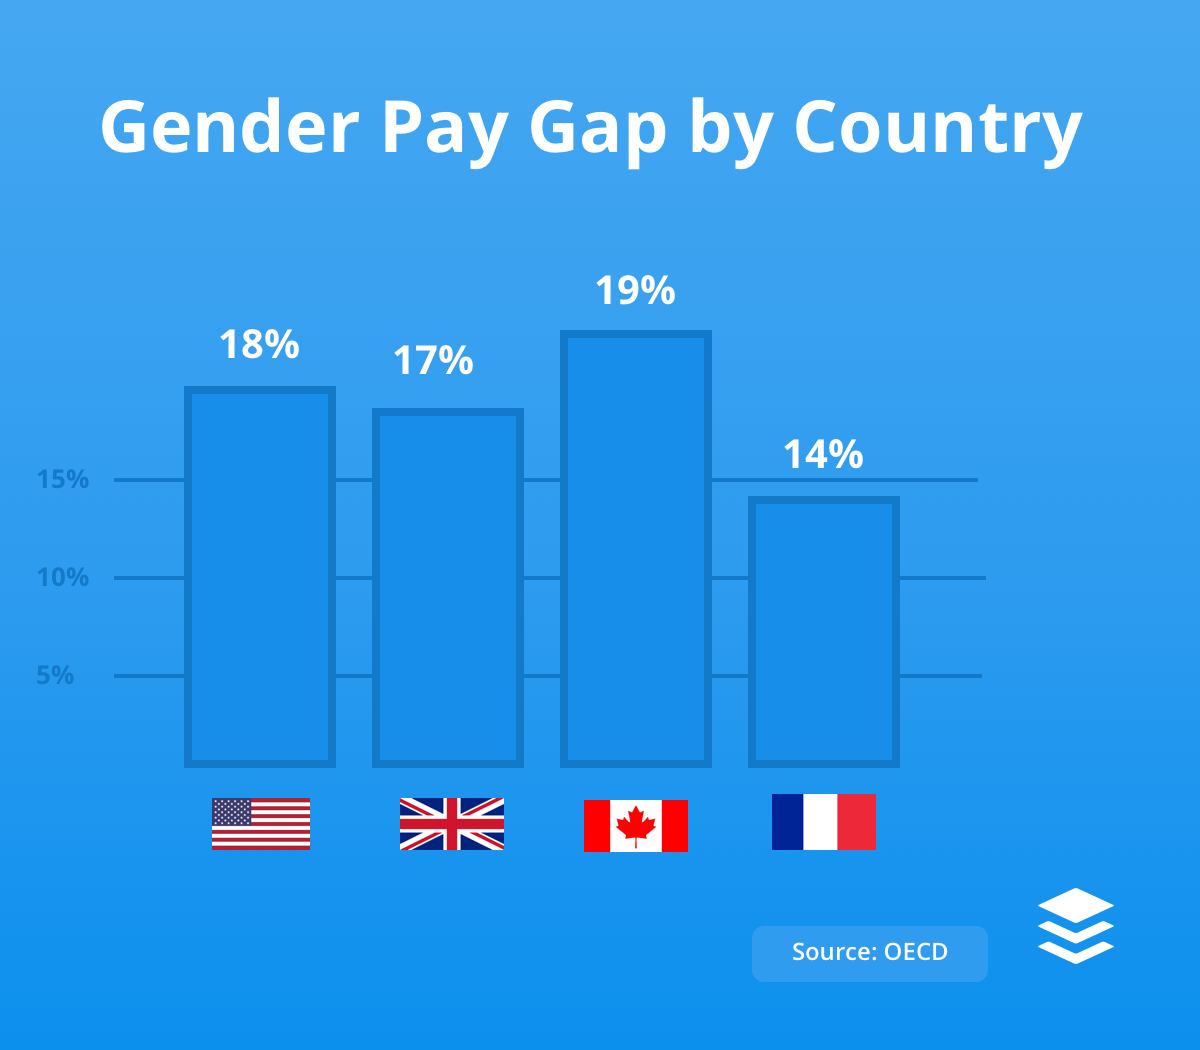
Buffer has remote employees in over 17 countries worldwide, and the average gender pay gap varies quite a bit from country to country. Here’s the gender pay gap in the four primary countries where we have both men and women working at Buffer:
We’re also a tech company in an industry that is traditionally male-dominated, specifically with men in more technical roles. These technical roles are typically higher-paying, which can influence the gender pay gap. Though the influence might be less than you’d think.
Using data from 2013 to 2015, PayScale put together an analysis of how the gender pay gap affects the tech industry compared to the non-tech industry. They segmented the data by job level, using categories for individual contributors, manager, director, and executive.
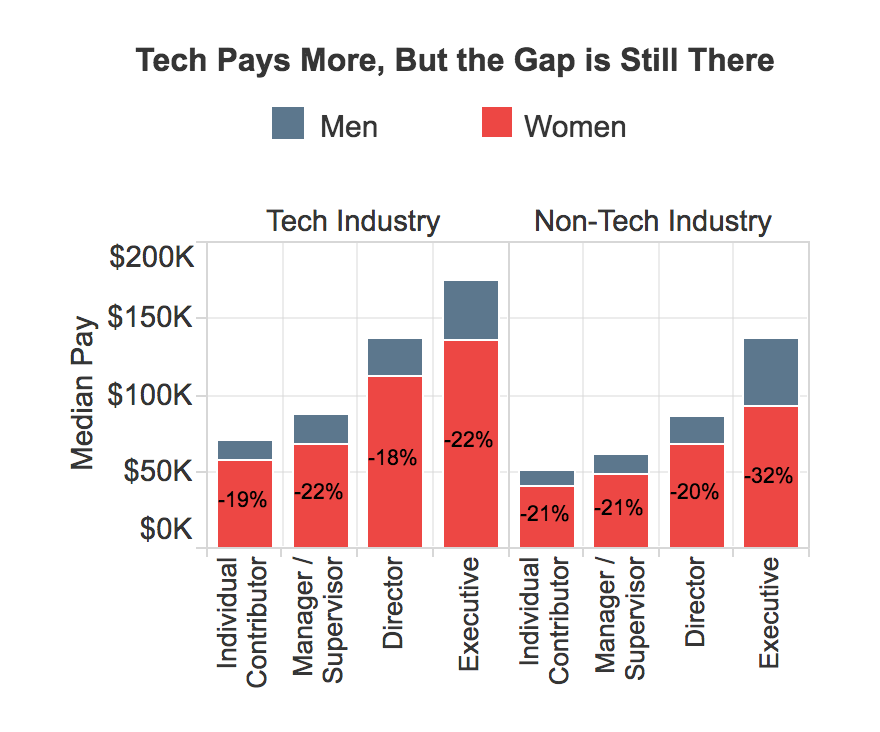
In most cases, the gender pay gap in tech is lower than the gap in non-tech industries. Still, the gap is significant, and there’s a lot of work we can do.
Buffer’s 2017 Equal Pay Analysis
Equal pay, and more specifically the gender pay gap, is something we plan to constantly track and continue to improve. We’re grateful to be part of this conversation as it feels quite in line with our company values of transparency and doing the right thing. We also feel that more transparency around the gender pay gap could potentially be valuable to other tech companies and startups that are still learning about this.
Here are our numbers as of March 2017
We are a team of 75 people. The gender split among our team is
- 23 women (31% of the team)
- 52 men (69%)
To make sure we show the full picture of how teammates get paid at Buffer, we looked to PayScale for inspiration and best practices on how to display our equal pay data.
Inspired by Payscale’s approach, we broke our data into the uncontrolled number, which compares all men and all women at Buffer regardless of role, and the controlled number, which compares men and women in similar jobs.
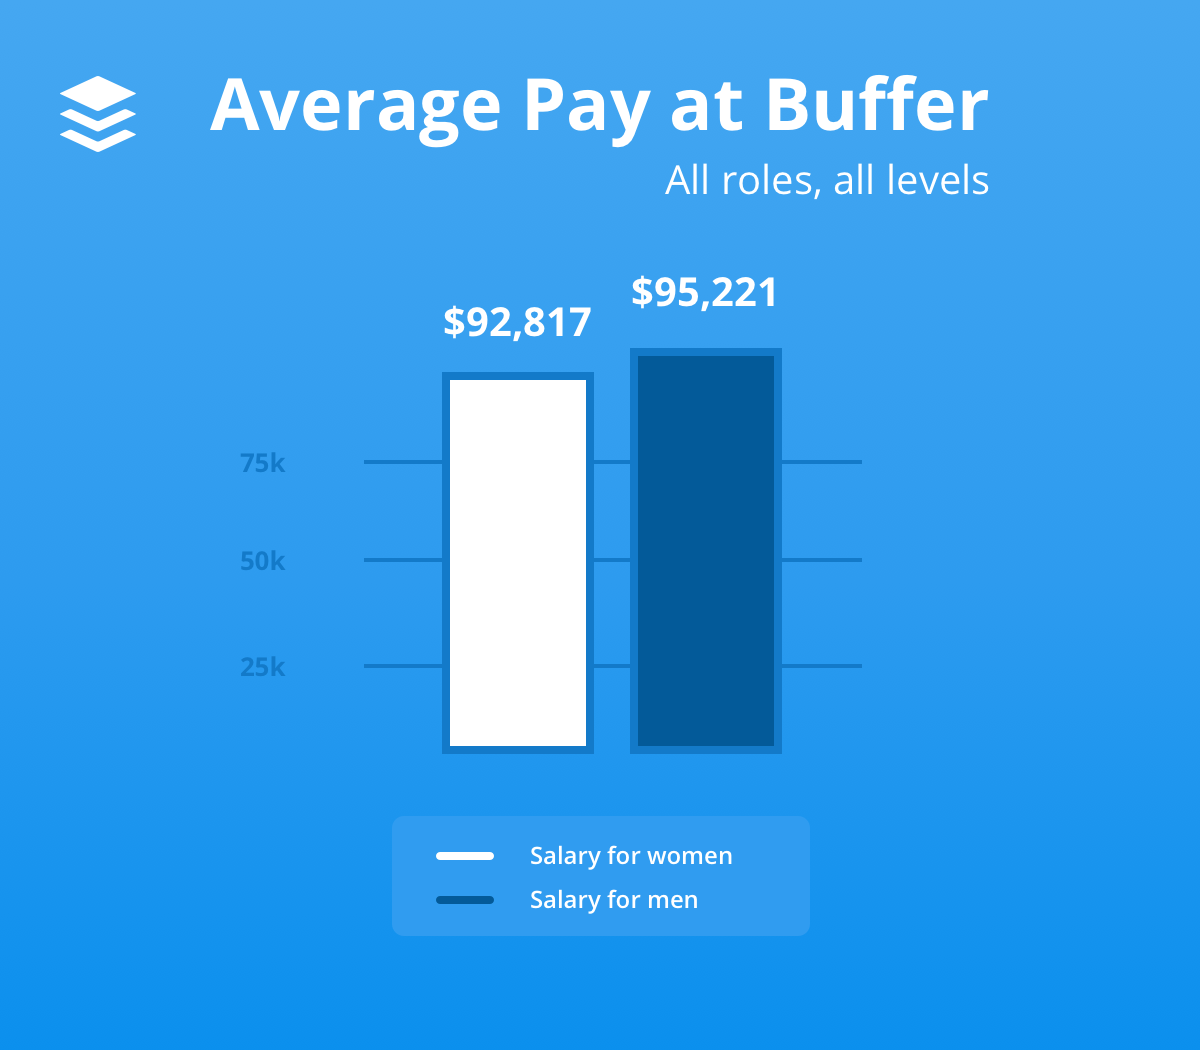
Buffer salary comparison, across all roles and job levels
- The average salary for a teammate at Buffer is $94,453.
- Women earn $92,817 per year, on average.
- Men earn $95,221 per year, on average.
- The gap between men and women is 2.5 percent higher for men.
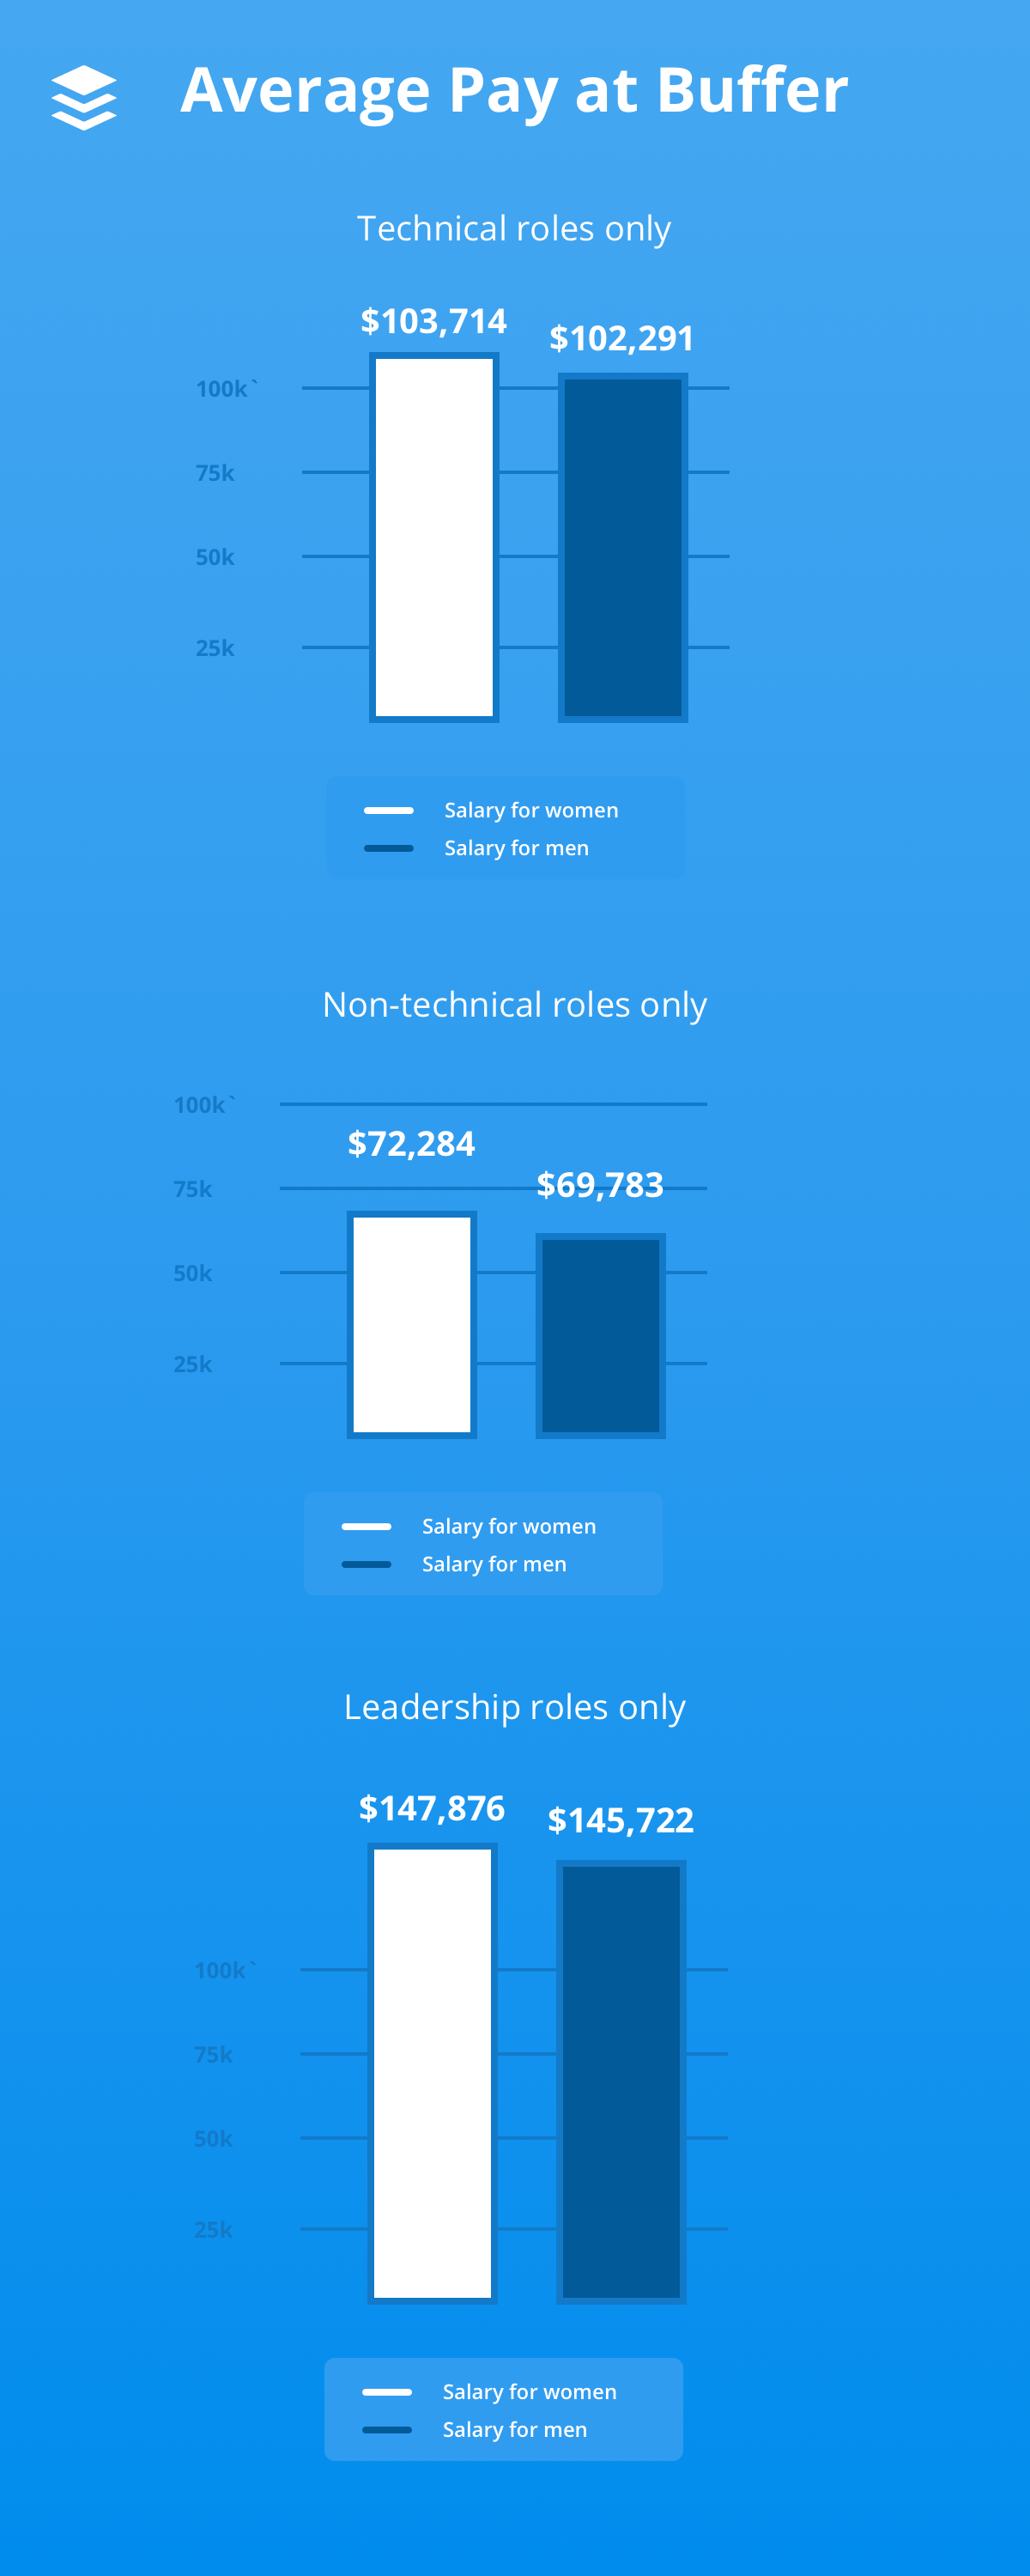
Buffer salary comparison, controlled for technical roles, non-technical roles, and leadership:
For technical roles:
- Women earn $103,714 on average
- Men earn $102, 291 on average
- The gap between men and women is 1.4 percent higher for women.
For non-technical roles:
- Women earn $72,284 per year, on average.
- Men earn $69,783 per year, on average.
- The gap between men and women is 3.6 percent higher for women.
For leadership roles:
- Women earn $147,876 per year, on average.
- Men earn $145,722 per year, on average.
- The gap between men and women is 1.5 percent higher for women.
Did you happen to notice how the average salaries for women are all higher here but they are lower in the overall average for all roles above? This is called Simpson’s Paradox. More on this below.
Here’s a bit more about how we defined each of these controlled groups. Our leadership team comprises directors, VPs, and C-level executives across each area of the company. We defined technical roles as those in engineering, product, design, and data. We defined non-technical roles as those in people, marketing, and customer happiness.
Again, we have an interesting paradox: The controlled averages for gender pay gap at Buffer show that women earn more than men … but the uncontrolled average shows that men earn more than women. How can this be? We’ll explain it in more detail below in the section for Simpson’s Paradox.
Notes about the data and calculations
Big changes to a small team can affect the averages substantially.
As a company of 75 people, our percentages are greatly affected by any additions or departures to our team. In the past year, there have been several big changes that specifically affected our team size and our salaries. The two most notable events were a round of layoffs last summer and the departures of our COO and CTO in January. Because of this, you may notice a significant difference between this year’s numbers and last year’s.
These calculations include only full-time employees at Buffer.
There were three men whose salaries were not included in the calculations because they are not full-time employees. One of these employees works for Buffer part-time, another is on a sabbatical (can’t wait to share more on this in the future!), and the other is Buffer co-founder Leo Widrich, who is staying on the payroll as an advisor through the end of this month (April 2017).
Our salary numbers do not include employee benefits like grants and salary/equity choice.
The salaries that we used to run these numbers are slightly different than the ones found in our transparent salary spreadsheet. In our public salary spreadsheet, we include a teammate’s choice for salary or equity, as well as a grant based on the number of dependents they claim. In the past, teammates could choose between taking extra equity or adding on $10,000 to their salary. Internally, we’ve been working to make a more explicit separation between salary and these other factors. We see the choice the salary/equity choice and the dependents grant as Buffer benefits, not salary. For this analysis, we removed the $10,000 and the dependents grant from the numbers we used.
Out of curiosity, we also ran the numbers with both the salary/equity choice and dependents grant included as part of the salary. The results were nearly identical to what you see above.
Simpson’s paradox: Why averages don’t always add up
OK, so you may have seen that the average salary is higher for women in technical roles, non-technical roles, and leadership at Buffer. However, the average salary on the Buffer team as a whole is much lower for women.
How is that possible?
This is an example of Simpson’s paradox.
Simpson’s paradox occurs when the average trends of subgroups reverse when the subgroups are combined.
This occurred for us when the controlled numbers (subgroups) showed a gender pay gap of women earning more than men, yet the uncontrolled numbers (the subgroups combined) showed a gender pay gap where men earned more than women.
Simpson’s paradox illustrates how averages can be problematic and it points out some of the of the less obvious challenges with equal pay.
In our particular case, the averages alone fail to tell a complete story because of the distribution of salaries across roles and gender. Buffer pays people equally for the same role. However, it’s still possible for the average man’s salary to be higher than the average woman’s … because Buffer has more men in higher-paying technical roles.
Why does this happen?
This occurs because there are four women and 32 men in technical roles at Buffer. Around 83 percent of women at Buffer are in non-technical roles, compared to around 35 percent of men. Plainly put, we have more men in technical roles, and these roles are generally higher-paid positions.
Looking back: Buffer’s 2016 Equal Pay Analysis
Last year was the first time that we started looking into equal pay. It was all very new to us, and we could have done a better job of looking at uncontrolled vs. controlled numbers. At the time, we mostly looked at the uncontrolled numbers, which showed a $9,500 gap between men and women (with men earning more).
Compared with this year, the uncontrolled number for our gender pay gap went down by quite a lot, from $9,500 in February 2016 to $2,404 in March 2017.
Why did this number change so much?
There are a couple significant factors:
- Change to the number of leadership positions and the gender ratio of those roles. This time last year, our leadership team was four people. Now, the team is nine people, made up of five women and four men. Along with several promotions of women leaders, we’ve also hired a female VP of Finance.
- The departure of two of our highest-earning men. In January, our COO and CTO both moved on from Buffer.
What’s Next for Equal Pay at Buffer
We’ve started to define career paths more clearly
A huge learning from last year’s equal pay analysis was that women were generally in lower experience levels within our salary formula than men.
For this reason and others, we felt we could have had a better career path framework in place so that everyone at Buffer knew when they might be in the next experience level category and not feel that they need to ask for a promotion (a factor often cited in gender pay gap analyses).
This year, we’re excited to take a small step forward in that direction. Several of our teams (Engineering, Marketing, Happiness) now have team-wide experience level career frameworks. This way, everyone on the team can understand what it might take to advance to the next level. This is something we’re hoping to roll out to everyone at Buffer in the near future.
We’re reiterating our salary formula
While it was our intention to remove bias and inequality from our salary formula, we learned that both experience levels and bias were something we could have done a better job predicting and removing.
We’re working on a new version of our salary formula (with the help of our new VP of Finance), coming out later this year. Our goal with the new formula is to continue trying to remove any bias from the way we pay our teammates and to simplify the formula as much as possible.
—
These are definitely not complete solutions to the gender pay gap. They are what we’re currently experimenting with and hoping to improve on. We’re keen to keep learning and growing in this area. Plus of course, we’re excited to keep track of numbers like this so that we can make more informed decisions.
Putting this report together was a big team effort. Huge thank yous to Julian who did all of the data analysis, Kevan for all of the editing, Courtney, Jenny and Ruth who each added valuable thoughts and gave great advice. :)
More Data: Here Are a Few Great Places To Learn More About the Gender Pay Gap
- Data on the Gender Pay Gap and Salary Transparency, Glassdoor
- Women in Tech and the Gender Pay Gap, Payscale
- The Gender Wage Gap, OECD
- Simpson’s Paradox, Vudlab
—
Photo by Gregoire Jeanneau.
Try Buffer for free
140,000+ small businesses like yours use Buffer to build their brand on social media every month
Get started nowRelated Articles

How the Buffer Customer Advocacy Team set up their book club, plus their key takeaways from their first read: Unreasonable Hospitality by Will Guidara.

In this article, the Buffer Content team shares exactly how and where we use AI in our work.

Here we go again. If you work in social media, it’s nothing new to adapt and change your strategy based on the ever-changing algorithms and the rise and fall of social networks. (Who else was on Vine? 🙋🏻♀️) But, of course, we wish you didn’t have to. The latest wave for social media marketers and creators is that TikTok might be banned in the U.S. The short-form video app has become one of the most widely-used social media platforms and is credited with impacting trends and cultural shifts.