
Continuing to Improve on Pay: Our Latest Changes to the Salary Formula and How Much it Costs


Director of Business Operations @ Buffer
We live in a world where things are constantly changing, and Buffer is no exception, especially when it comes to how we pay our team!
It’s been over five years since we first introduced transparent salaries and a salary formula at Buffer. We’ve been revisiting and evolving the formula ever since.
Case in point, here are the milestones of Buffer’s salary formula evolution over the years:
2013: Introducing Open Salaries at Buffer
2015: Introducing the New Buffer Salary Formula
2017: The Next Evolution of Transparent Salaries
Now, rather than make sweeping, reconsider-everything changes to the formula (like in the blog posts linked above), we’ve adopted a model that allows us to tweak and adjust different components as our team grows and develops.
Most recently we’ve made changes to the formula in order to include company-wide career frameworks, a new salary data source, and more opportunities for raises and for recognition.
All the details are below, including specifics on the budget impact of making changes to salaries (for an 80-person team!).
You can check out the new transparent salary spreadsheet and the whole team’s updated salaries here!
Why the change
Our most recent salary formula evolution, which came in October of 2017, benchmarked every teammate’s pay to the San Francisco labor market. We introduced the idea that the work and value each teammate brings to Buffer is not limited by where they work from, and our compensation for their contribution shouldn’t be, either.
This was a pretty big overhaul to the previous salary formula, and it helped us toward our vision of a salary formula that is flexible enough to adapt with us over time.
We think we’re one step closer with these recent changes.
We’ve adapted the formula by making smaller changes that align with our changing team needs and structure. We still have a remote-first formula that is benchmarked to the San Francisco labor market, but this next iteration brings some key new aspects: integration with our new team-wide career frameworks, a new compensation data source, and a new opportunity for teammates to receive raises outside of larger promotions.
Let’s dive into the details!
The goals of our salary formula changes
We had three goals in mind as we thought about the next evolution of the formula.
- Re-benchmark base pay
- Re-evaluate our salary-data source
- Integrate the new company-wide career frameworks
We wanted to re-benchmark salaries for all roles by comparing our current pay to the market in order to ensure our pay is keeping up with market trends.
Evaluate and consider adjusting the data source used in the salary formula
Tie together all career frameworks across the company for overall consistency
The result: A unified career framework, a new data source, and a new salary spreadsheet
1. Integrating a company-wide career framework
Buffer’s new unified career framework introduces a system of levels and steps for each role to make sure teammates have the opportunity to grow in flexible ways.
- Levels: Levels are large and distinct jumps in terms of area knowledge, role complexity and overall scope. These are the typical promotions that happen through our calibrations, which is when we evaluate how a teammate has grown within their role. Levels make up the vertical axis of our new career matrices and there are six levels for both individual contributors and managers.
- Steps: Four steps are housed within each level and are meant to mark smaller milestones of growth in terms of ownership and initiative as determined by each teammates’ lead. Steps are not necessarily meant to be a strictly linear progression; teammates can potentially advance multiple steps at once.
Each area now follows a similar format that looks like this:

The new career framework means we no longer need the Role Multiplier or Experience Factor that were a part of our salary formula in the past. These components are now built into our framework in a consistent way across the entire company.
This also means that teammates no longer have to wait for a promotion to the next level in their career framework in order to see a raise. Raises can happen more organically as a way to reward teammates for their individual contribution to the team. The idea is that teammates can have a clear path for compensation and recognition without having to wait several years for a promotion.
2. Re-evaluating our salary-data source
We’ve always held that compensating people based on a specific labor market is a good starting point for pay. For that reason, we use the San Francisco labor market as the starting point to benchmark our salaries.
We don’t use that data as the only factor in pay, but we do rely on it as a guide to make sure that we are keeping up with (or exceeding!) market wages. In the past, we’ve relied on market data from Payscale, which served us well.
This year, we decided to spend some time evaluating other data sources that could be a good fit for our team as we grow. We looked at options like Dice and Paysa, and in the end we landed on Radford, which gathers compensation data by participating in their global survey platform.
One thing we really like about Radford’s approach is that every company who participates is given guidance on how to map jobs to the market so that there’s consistency across all participants. We found that this greater level of oversight means we can be confident that the way we are matching roles to the market aligns with the way that other companies are matching roles in the market, since we’re all following the same criteria set by Radford.
Radford provides a “job code” for nearly every role that a person could have. This “job code” is a title and a description of the role, and each one has a unique number. Once you determine the job code that matches the job description for your internal role, you’re then able to filter the data based on Industry, Region or City, Revenue, Range, Headcount, Ownership Type, and Organization.
We found that Radford is user-friendly and provides a wide variety of job codes and a large data set. We also felt that we had greater confidence in the underlying data since we also participate in the survey and are able to see the extensive process involved in how the data is vetted for each role. The data passes multiple rounds of quality assurance by the team at Radford, and we feel this brings a greater level of accuracy to our benchmarking data.
In the end, we retired our Payscale data and replaced all underlying salary data with the Radford numbers.
3. Re-benchmarking every role on the team
With the unified career frameworks in place and a new data source available to gather our market compensation data, we went about re-benchmarking each role on the team. Our primary goal here was to make sure that our current level of pay is keeping up with the San Francisco labor market.
You can check out the new transparent salary spreadsheet and the whole team’s updated salaries here!
We made one big change to how we’re displaying our salaries: we are now prioritizing each teammates’ base salary, which you’ll find in Column B. We still have other components of total cash compensation, like our dependent grant and the legacy salary choice component, but these components are separate from base pay, which is rooted in objective market factors that are applied consistently across the team. Though these additional components remain as part of each teammates’ take-home pay, we’re now categorizing them as separate and not part of our overall salary formula.
The overall numbers
The budget impact of changes to a salary formula
We remain committed to our ongoing promise to our team that salaries will never drop when we iterate on our formula.
With the changes outlined above, almost every teammate received at least a 2% increase in base pay.
For the handful of teammates who didn’t see at least a 2 percent raise with the re-benchmarking based on the market, we issued a one-time, lump sum bonus that brought them to an extra 2% of their current base pay.
Overall, this project resulted in an annual budget increase of $711,565.
- This is a 7.87 percent increase over our previous base salaries
- The budget impact for the remaining months of 2018 was $125,207
Here’s a look at how each area’s base salaries changed from 2017 to 2018 due to re-benchmarking. The Y-axis represents the combined annual salaries of all teammates in each area.
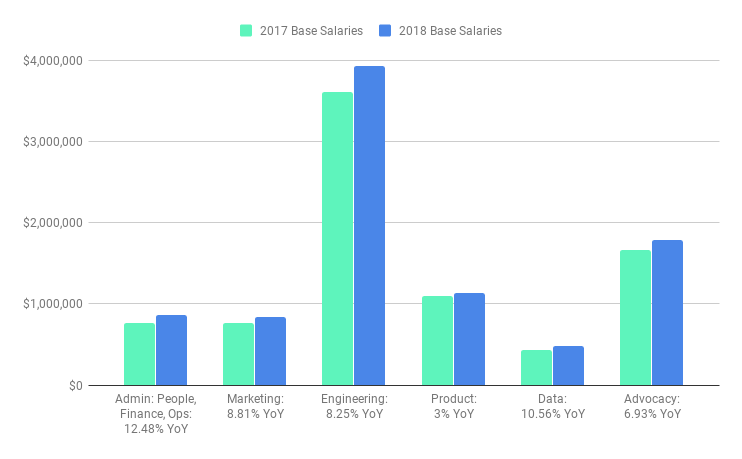
We surveyed quite a few compensation trend reports and these numbers feel appropriate given the trends we’re seeing in the market.
Coming up Next: Changes to the Cost of Living Factor
We decided not to make any changes to the Cost of Living Multiplier in our formula for now. This multiplier is still applied by using a teammates’ location to determine one of three geographic bands, based on a high, average, or low cost of living area. We use data from Numbeo to figure out which band applies for each teammate. For high cost of living areas we pay 100% of the San Francisco 50th percentile, average is 85%, and low is 75%.
We figure out each teammate’s geographic band by comparing the cost of living index of a teammate’s location to the cost of living index in San Francisco.
We’re very thankful we received some great feedback from our team on this element, and we recognize that we have some work to do in evolving this component of the formula. In fact, we’ve already queued this up as a project for early 2019 where we plan to propose changes!
Over to you!
How have you seen pay at your company adapt along the way? We’d love to hear from you!
Try Buffer for free
140,000+ small businesses like yours use Buffer to build their brand on social media every month
Get started nowRelated Articles

How the Buffer Customer Advocacy Team set up their book club, plus their key takeaways from their first read: Unreasonable Hospitality by Will Guidara.

In this article, the Buffer Content team shares exactly how and where we use AI in our work.

Here we go again. If you work in social media, it’s nothing new to adapt and change your strategy based on the ever-changing algorithms and the rise and fall of social networks. (Who else was on Vine? 🙋🏻♀️) But, of course, we wish you didn’t have to. The latest wave for social media marketers and creators is that TikTok might be banned in the U.S. The short-form video app has become one of the most widely-used social media platforms and is credited with impacting trends and cultural shifts.