Our 2018 budget is $11 Million, here’s exactly how we’re using it (Buffer Budget Series #2)


Director of Business Operations @ Buffer
We believe that numbers tell a story and we hope that anyone looking at our budget for the first time will have a good idea of what we value based on how we’re planning to spend our money.
Last month we shared our approach to creating a budget. Today, we’re excited to invite you to take a closer look at how that approach led to allocating dollars in our budget and how that influences the way we see and spend money here at Buffer.
In this post, we’ll aim to share how we allocate our $11.67 M operating budget to enable our team to fulfill the vision of Buffer and serve our incredible customers!
Our operating budget is made up of our anticipated operating expenses, or what it costs to run Buffer on a daily basis. We budget separately for hosting and merchant fees since these expenses make up the costs associated with providing our service, or the Cost of Goods Sold (COGS). More on that below!
After we set the vision and goals for our 2018 budget and kicked off some collaborative discussions, we began working on the granular detail of each budget category. We started by looking closely at our projected spend for 2017 and compared that to the budget we had set at the beginning of the year. In many ways, the 2017 budget to actuals served as our compass for setting the 2018 budget.
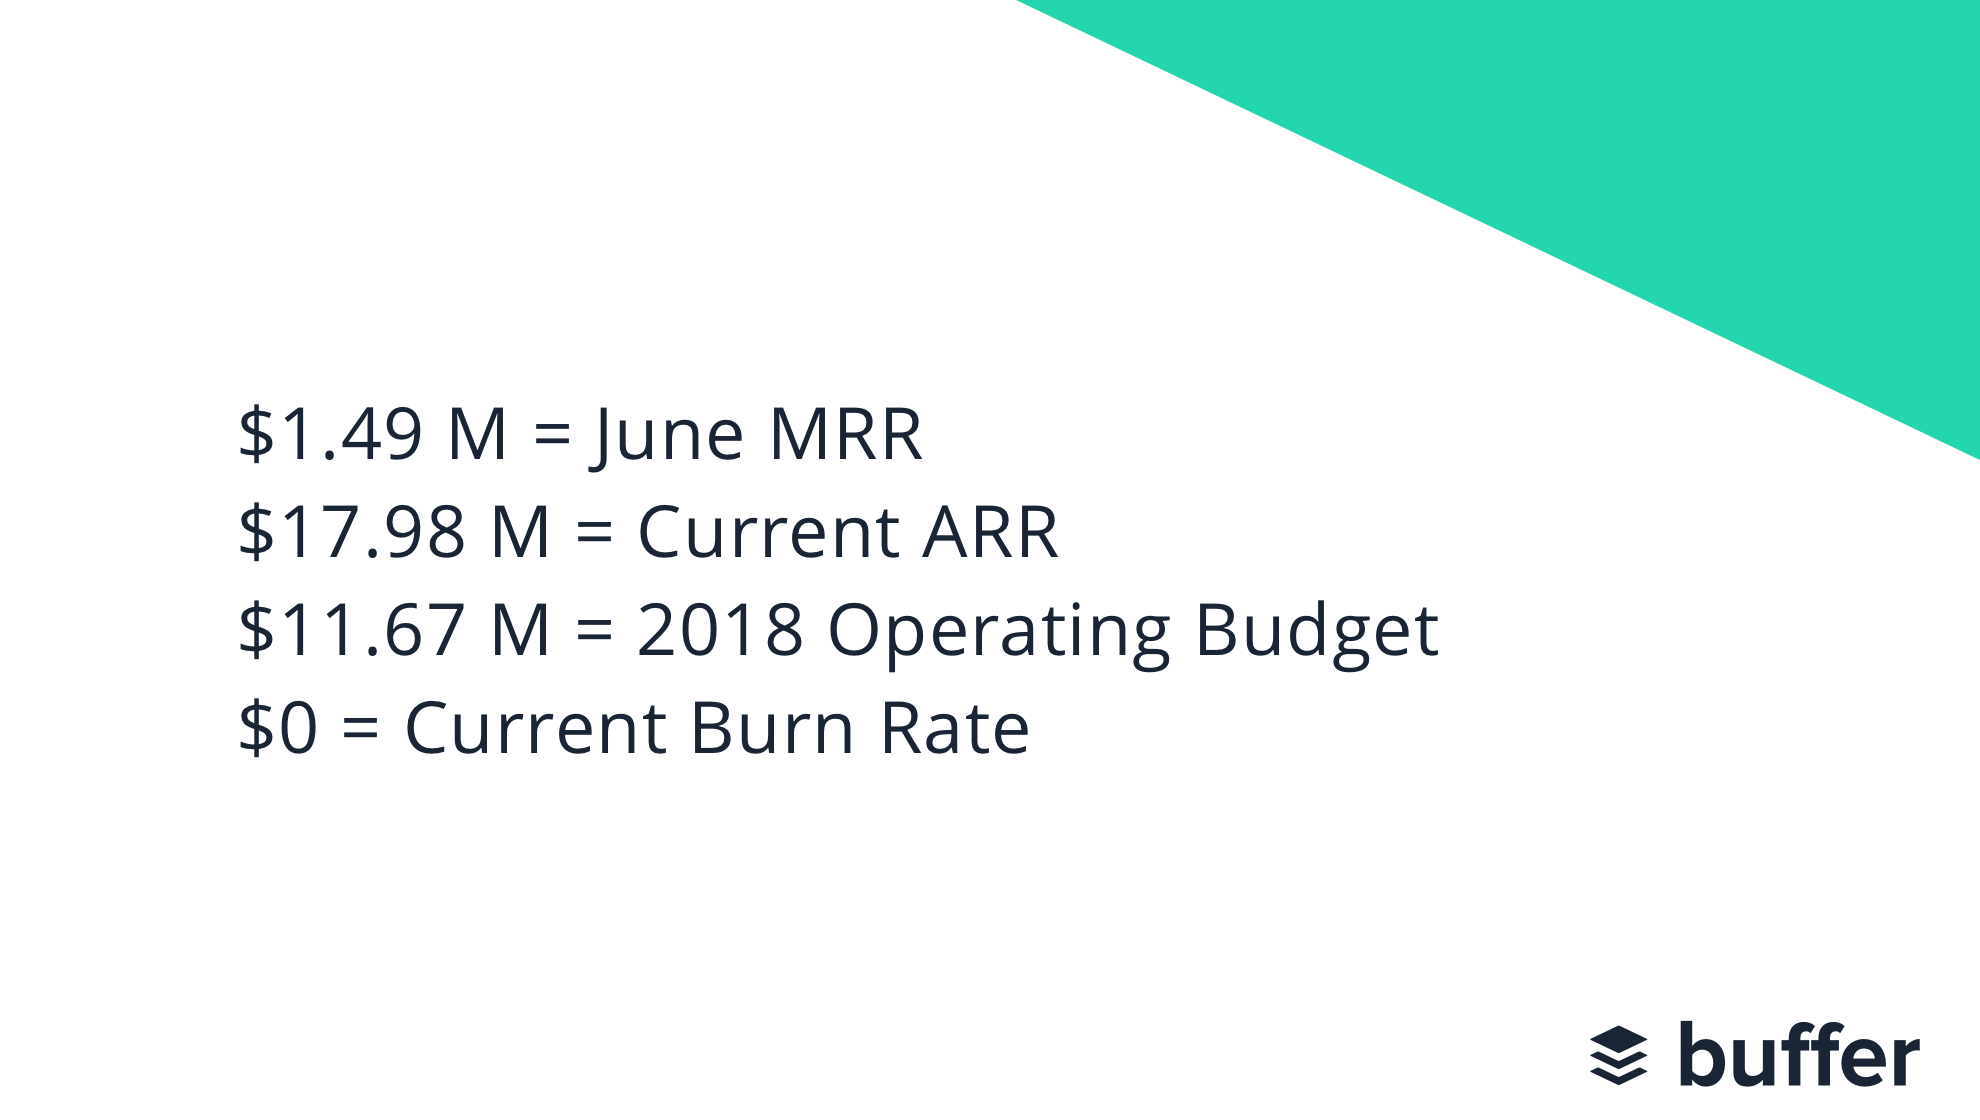
A Look into the Numbers
If you’ve been following Buffer’s journey for any length of time you likely know that we’re committed to sharing our journey transparently, including what we pay each team member. We also believe that the work and value each teammate brings to Buffer isn’t limited to where they work from and that’s why last October we made the decision to benchmark our compensation to the San Francisco labor market, regardless of where a teammate lives. Perhaps it won’t be surprising then to learn that of our total operating budget, Teammate Expenses, including compensation and payroll taxes, make up 82% of our total operating budget. Take a look!
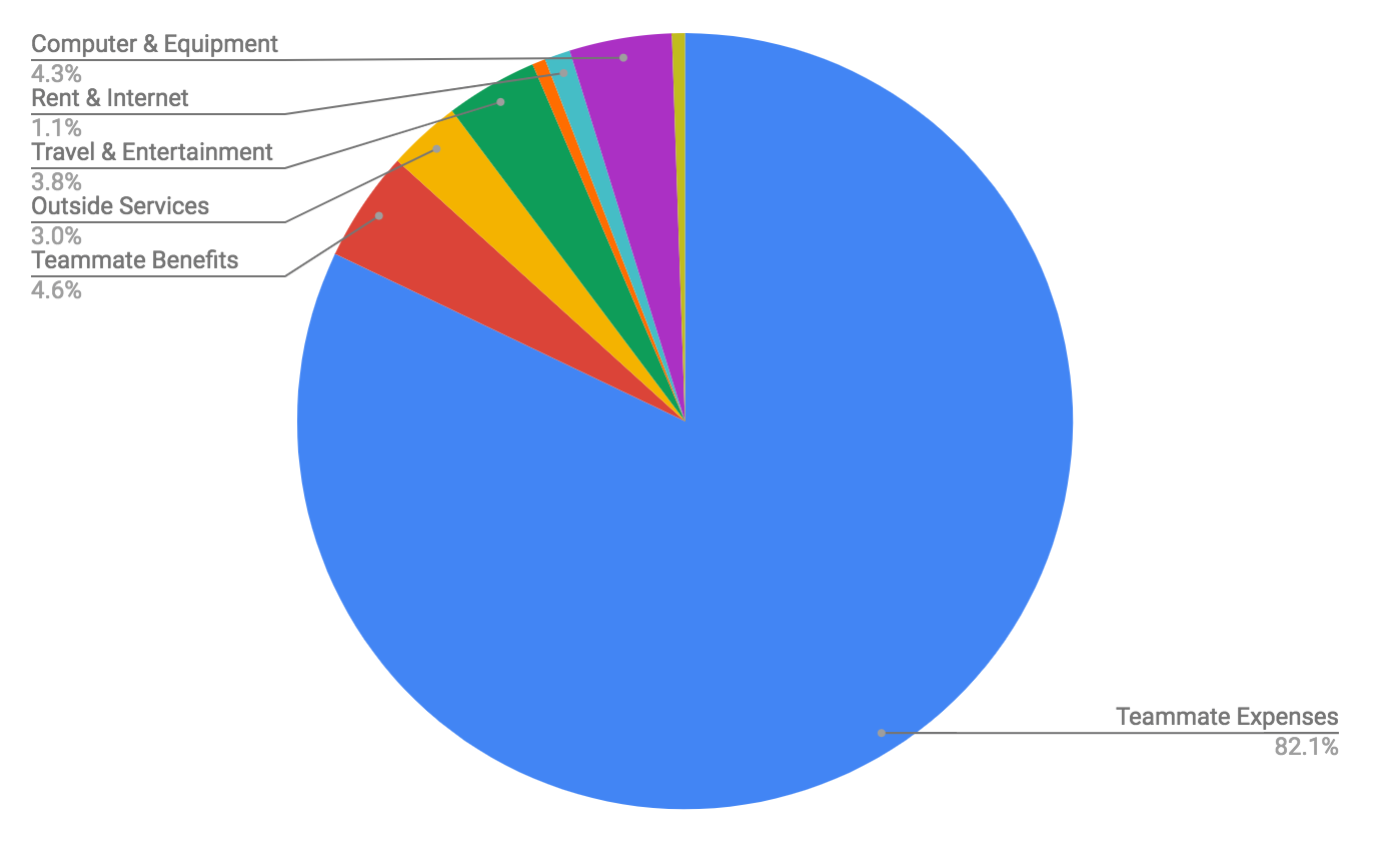

Here’s a closer look at how much we’ve allocated for each of the categories you see above:
| Teammate Expenses | $9,586,712 | 82.1 % |
|---|---|---|
| Teammate Benefits | $538,420 | 4.6% |
| Outside Services | $354,900 | 3% |
| Travel & Entertainment | $446,860 | 3.8% |
| Office Expenses | $64,284 | .6% |
| Rent & Internet | $125,000 | 1.1% |
| Computer & Equipment | $498,012 | 4.3% |
| Advertising & Marketing | $63,060 | .5% |
| Total Operating | $11,677,248 | 100% |
When we first started budgeting for our 2018 Teammate Expenses we looked at a couple of key things. First, we worked closely with our directors and team leads to put together hiring projections for 2018. Each area had a chance to review their needs and make hiring requests. In the end, we landed on a plan to add 10 teammates to the team by the end of 2018. We created a hiring forecast and planned our budget around the number of hires we planned to make each quarter. This brought our total 2018 budget for new hires to $646,000. Next, we took some time to look at and forecast what to anticipate for raises, both merit-based (promotions) and also salary increases when we re-benchmark roles in October to ensure that our salaries are keeping up with the market. After a good amount of planning and reflection, we landed on a budget of $300,000 for raises.
This brought our total Teammate Expense budget to $9,586,712, which is a 10.5% increase from 2017. With our revenue projections in mind and recognizing that it was time to grow our team again, we felt like a 10.5% increase was a great way to invest in Buffer through both hiring and rewarding our current team for their impact and contribution.
When planning our budget for Teammate Benefits we started by looking at our current benefits like continuing education (this includes our free unlimited kindle perk!), health insurance, conferences, workers compensation insurance, and team training. You can read more about our benefits here! We looked at our current benefit offering and created a forecast for what to expect for the natural inflation in these costs with our plan to add 10 teammates in 2018. We also decided for 2018 that we wanted to create more room in our budget for team training, conferences (we doubled this budget from 2017!), and for the addition of some tools to promote team morale and health. To date, we’ve held an Ally Skills workshop for the team, opened up opportunities for our leads and directors to hire coaches, and we also signed up for Joyable, an online digital therapy service, for our team and their dependents to use!
The budget allocation for Outside Services includes our budget for accounting (we currently outsource this function), consultants (this includes tax advisors, graphic design etc), recruiting costs, legal fees, and payroll services. We held this budget pretty steady from 2017, with one addition: we added recruiting costs back into the budget on account of our 2018 hiring plans.
You might be wondering how and why our Travel & Entertainment budget is almost as much as our Employee Benefits and that’s because each year we host a team-wide retreat where the whole team gathers to spend a week together. We believe that our company retreats are a powerful way for the team to connect, plan for what’s ahead, and work on projects together. We typically budget about $5,000 per teammate. For 2018, we also budgeted for each team to hold a mini-retreat or a way to gather in smaller groups to work on projects. When planning for this category, we found that the 2017 mini-retreat budget was too restrictive so we increased this to $1,400 per teammate so that teams could have more flexibility to make plans to meet up outside our annual team-wide retreat.
Office Expenses includes allocating money for bank charges, business insurance, and supplies & materials (like company swag!). From 2017 to 2018, we doubled this budget to account for increases to our business insurance premiums and to add some cushion to our supplies & materials budget for things like company swag.
Rent and Internet is a way for us to allocate money so that teammates can work from wherever they’re happiest. We set aside money to reimburse teammates for co-working and internet costs. When we took a closer look at our 2017 budget to actuals we found that we were under budget for the year in this category. For 2018, we adjusted this budget category down, by about $5,000, to better account for our anticipated spend. Even with this adjustment, we were still able to expand the co-working benefit to include Coffee Shop Working.
Our Computer & Equipment category includes just that – making sure we have money set aside for our team to get the equipment that they need to do their best work! We typically replace computers on a three-year cycle and this year we also introduced a $200 stipend, per teammate, for each person to purchase equipment that will help them work smarter. This might include a pair of headphones, a keyboard, or an office chair; each teammate can choose whatever suits them!
Software expenses also fall under our Computer & Equipment category and as a fully distributed team you can imagine that we rely heavily on many tools to stay connected. Our total budget for software expenses is around $400,000, up by about $36,000 from 2017. This increase was mainly due to anticipating higher software costs for our growing team and also adding some key tools within Engineering, Product, and Marketing.
Within Advertising & Marketing we budget for advertising, like running Facebook ads (this year we’ve budgeted $48,000), conferences & trade shows, and miscellaneous marketing expenses. We held this budget steady from 2017 to 2018.
See a more detailed break-down here!
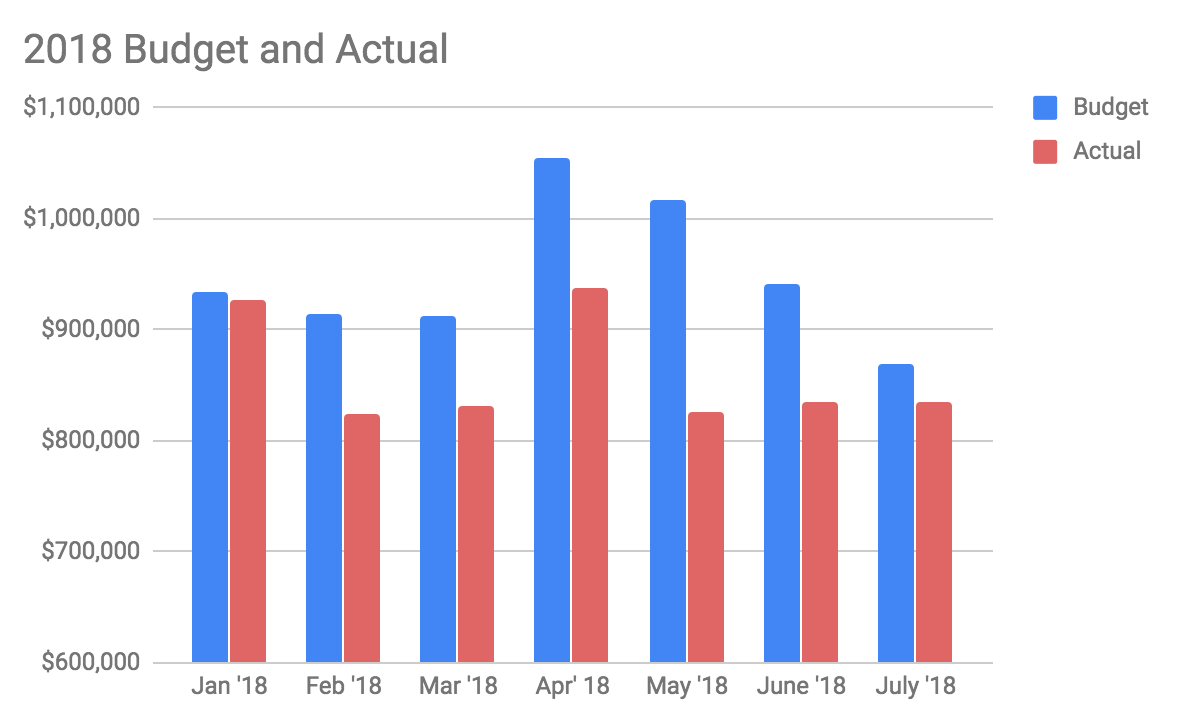
YTD Budget to Actual
So, how are we doing so far this year in meeting the budget that we set? As of our July close, we’re $699,000 under-budget for the year. This is primarily due to hiring at a slower pace than anticipated and natural team attrition.

Being so far under-budget for the year is a great learning for us. For example, we’ve learned a lot about how quickly we can hire and this will help us set more realistic goals for next year and hopefully budget more closely to what we will actually spend. Since we’re under-budget, to date, we’re currently looking at ways to reinvest back into the company.
Cost of Goods Sold
As a SaaS company, one of the largest expenses that we plan for is the cost of hosting our service as well as the cost of merchant fees. Hosting costs and merchant fees make up the direct costs associated with providing our service and so we account for these as the Cost of Goods Sold (COGS), rather than a part of our operating costs where we focus on the costs associated with running the business operations on a daily basis.
For 2018, we budgeted $1,549,000 for Cost of Goods Sold. This includes Hosting fees like Amazon Web Services (AWS), Compose, Twitter, Fivetran, Cloudflare, MongoDB Cloud, Amazon Redshift, and Google Cloud Platform. We also budget for merchant fees within Cost of Goods Sold and today our merchant fees come out to about 4.7% of our revenue.
Here’s how we’ve done so far this year with our COGS budget:
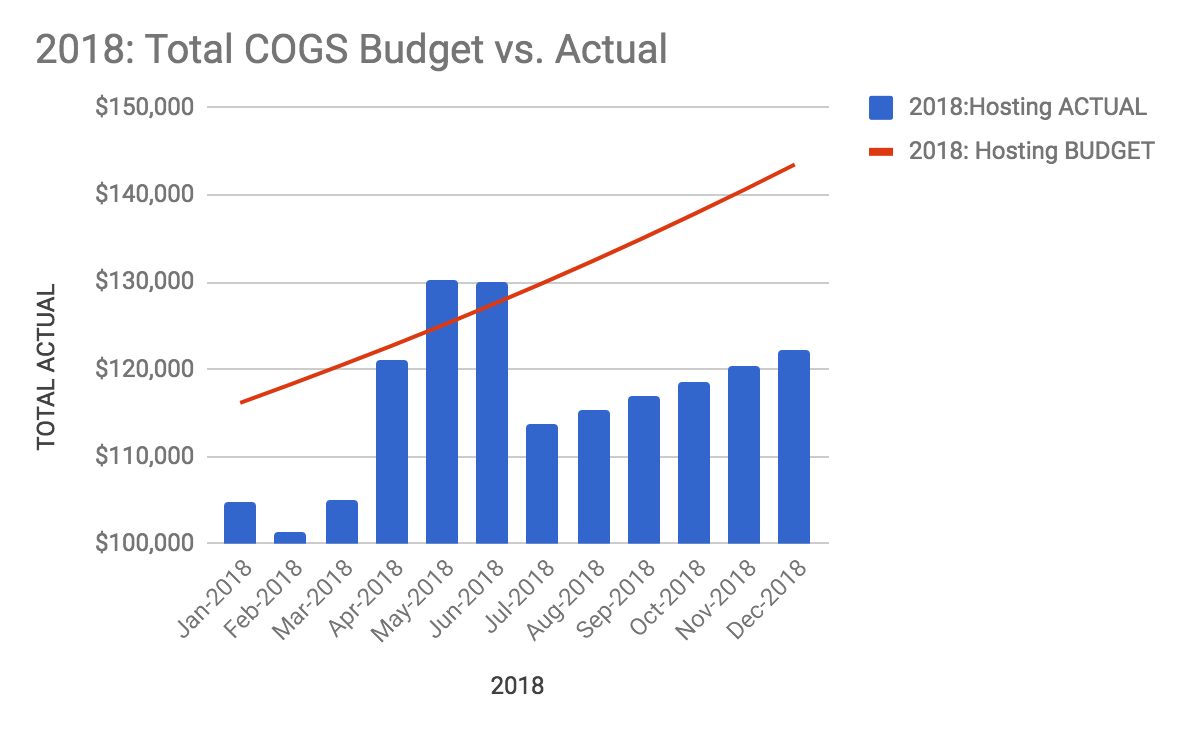

As you can see, we’re under-budget for the year even with some higher charges between April-June. We saw higher costs in these months because we purchased some Reserved Instances from Amazon. Our systems team did some research and found that by paying more upfront we could save money over time. Since we were already under-budget for the year this was a win-win for us.
Revenue v Expenses
Budgeting is a great way to understand how we prioritize spending, but that’s only half the equation. When we set our budget for 2018 we did so with specific revenue goals in mind. We think it’s really important to make sure that we’re not only on track to meet our budget goals, but that we’re also on track with what we projected for anticipated revenue. For 2018, one of our goals was to make sure that our expenses didn’t outpace our revenue in order to make sure we weren’t burning cash. Here’s a glance at where we’re at so far!
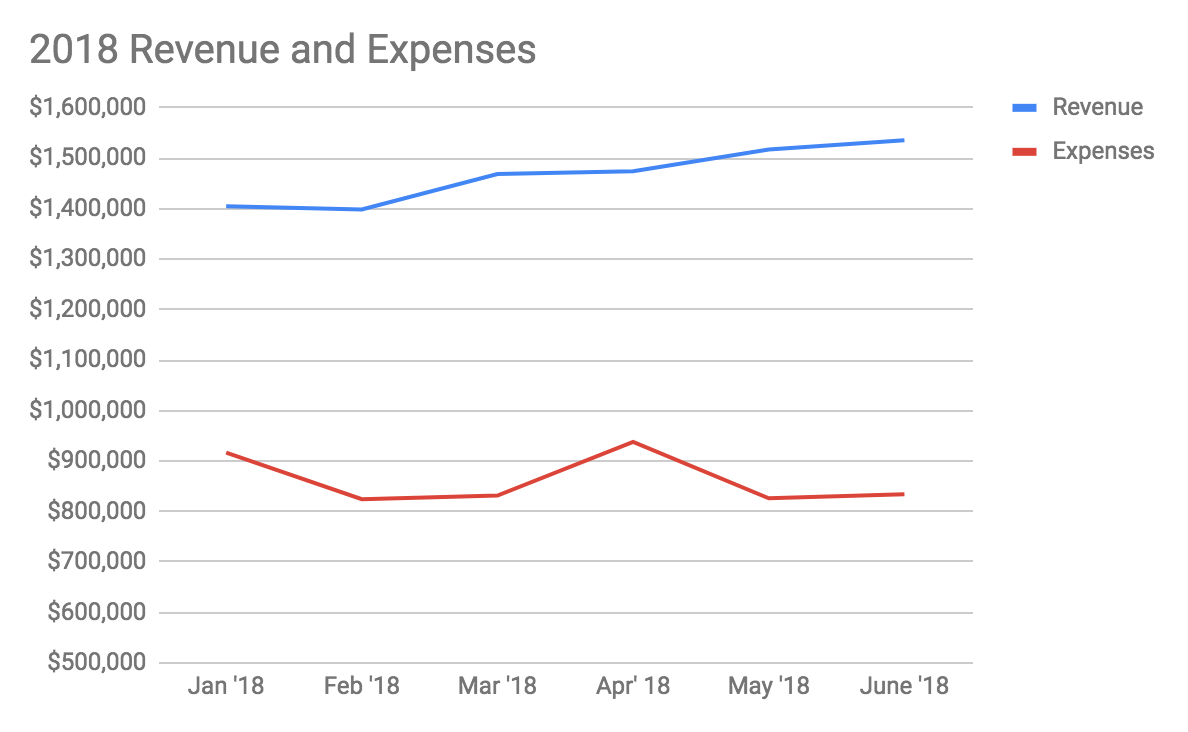

In April, we gathered in Singapore for our 9th company-wide retreat and that accounts for the spike you see in our expenses for April. We plan for this well in advance and you can see that our expenses go back to a more consistent pace after the retreat.
Over to You
We’d love to hear from you! Does your company create a budget? Does our budget spark any questions? Leave a comment below! ?
Photo by rawpixel
Try Buffer for free
140,000+ small businesses like yours use Buffer to build their brand on social media every month
Get started nowRelated Articles
TikTok's parent company must divest the app by 2025, or face being banned in the U.S. Here's everything we know, plus how to plan ahead.

How the Buffer Customer Advocacy Team set up their book club, plus their key takeaways from their first read: Unreasonable Hospitality by Will Guidara.

In this article, the Buffer Content team shares exactly how and where we use AI in our work.